Why Standard Financial Templates Don’t Support Real Reporting Needs
Most organizations structure their operations around cost centers, business units, projects, or product lines. Yet pre-built financial reports rarely accommodate these dimensions. Finance teams end up manually consolidating data from multiple sources, reformatting spreadsheets, and building custom pivot tables just to answer basic questions about departmental performance or project profitability.
When executives ask for a profit and loss statement filtered by sales department, or a balance sheet that compares this quarter against last year’s same period, the process shouldn’t require IT involvement or hours of manual work. Financial report configuration ERP systems like Onfinity address this by separating report structure from data, letting you define how information should appear once, then generate updated reports repeatedly as transactions post.
Building Report Structures That Reflect Your Business Logic
Report configuration in Onfinity starts with two core components: report lines and report columns. Lines define the rows of your financial statements—revenue categories, expense classifications, asset types—organized in whatever sequence makes sense for your organization. Columns represent time periods and comparisons: current year, previous year, year-to-date accumulation, or custom date ranges tied to your fiscal calendar.
Each report line connects to your chart of accounts either directly or through reporting groups. Direct linkage means selecting specific ledger accounts like trade revenue or service revenue. Indirect linkage uses reporting groups—collections of related accounts that update automatically when your chart of accounts changes. If you add a new revenue account to your structure, reports linked through groups pick it up without reconfiguration.
Calculation rows handle totals, subtotals, and variances using formulas that reference other report lines. For a profit and loss statement setup, you might define rows for sales, other income, and a calculation row that adds both to show total revenue. Another calculation row subtracts total expenses from total revenue to display net profit. These formulas update automatically each time you generate the report.
This separation between structure and data means you configure your profit and loss or balance sheet format once. After that, generating monthly, quarterly, or annual versions requires only changing the date parameter. The system pulls current data and applies your defined structure, formatting, and calculations.
Filtering Financial Performance by Department, Project, or Product
Dimensional filtering works at both the report line and column level. Apply a dimension filter to a specific report line to show revenue or expenses for individual products, business partners, or campaigns. For example, if you want to see sales for a particular product line, select the product dimension on that report line and choose the product reference. The line displays only transactions tagged with that product.
Column-level filters enable side-by-side comparisons. Generate a profit and loss with one column filtered to the sales department and another to the operations department. Both columns use the same report line structure, but each pulls data from different organizational units. This approach supports both consolidated executive reporting and detailed operational analysis without maintaining separate report configurations.
Balance accumulation settings determine how transactions roll up when multiple dimensions are active. Options include daily accumulation, calendar month accumulation, or accumulation by specific accounting periods. Daily accumulation generates one entry per ledger account per day, grouped by active dimensions. If you post revenue for two different products on the same date and enable daily accumulation with product as a dimension, the system creates two separate entries—one for each product. This granularity supports detailed variance analysis and drill-down capabilities.
Managing Period Comparisons and Year-Over-Year Analysis
Columns in Onfinity financial reports automatically adjust based on the reporting date selected at runtime. Configure a column as current year, and the system displays data for whichever year you select when generating the report. Configure another column as previous year, and it automatically shows the prior year’s data. A variance column uses a formula to subtract previous year from current year, calculating the difference without manual intervention.
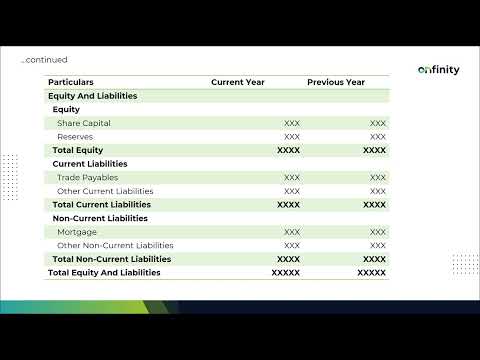
For balance sheet reporting system needs, accumulation options include opening balances up to a specific date or period-end closing balances. When generating a balance sheet for December 2024, you might configure one column to show closing balances for December 2024 and another for December 2023. A third column calculates the variance, highlighting changes in asset or liability positions year over year.
Year-to-date accumulation works by defining a column to accumulate from the start of the fiscal year to the selected period. If you generate a report for September and enable this option, the column shows cumulative data from January through September. Another option accumulates from the defined period to year end, useful for comparing actual performance against remaining budget or forecasted figures for future months.
The update balance option ensures the most recent posted transactions are included before report generation. When enabled, the system refreshes balance accumulation to incorporate all transactions that have been posted but may not yet be reflected in previously accumulated data. This maintains accuracy when generating reports shortly after period-end closing activities.
Formatting Reports for Executive Presentation
Conditional formatting rules automatically highlight variances, negative balances, or threshold breaches using color, font weight, or background shading. Define a rule that any negative variance should display in red with bold text. When the report generates, the system applies this formatting wherever the condition is met. Another option sets a fixed value—if any figure is negative, display zero instead. This keeps presentation clean when showing summarized data to stakeholders who don’t need to see every negative line item.
Row-level formatting applies consistent styling to headers, subtotals, and calculation lines. Assign one format to all header rows—perhaps bold text with a light gray background. Apply different formatting to total lines—double underline with bold text. These visual cues create hierarchy and make reports easier to scan during review meetings.
Suppress zero-value lines to keep reports concise when certain accounts have no activity in the selected period. Enable this option, and any report line showing zero across all columns is automatically excluded from the generated output. This prevents clutter and focuses attention on accounts with actual transactions or balances.
Horizontal line options add single or double underlines before or after totals, matching standard financial statement presentation conventions. Export completed reports to PDF with custom page sizing, maintaining all applied formatting. CSV export provides raw data for further analysis in external tools while preserving column structure and calculations.
From Configuration to Repeatable Financial Reporting Workflows
Once configured, financial reports become reusable templates. Build your profit and loss report configuration structure once, then generate monthly, quarterly, and annual versions by changing date parameters and re-running the report. The same structure accommodates different organizational units, projects, or product lines through dimension filters applied at runtime.
Drill-down capabilities let users click into any line item to see underlying ledger accounts, transaction sources, and posting details. If a variance appears larger than expected, click through to view the specific invoices, journal entries, or payment transactions that contributed to that line. This traceability reduces time spent investigating anomalies and increases confidence in reported figures.
As your chart of accounts evolves or new dimensions are added, report structures update automatically through their linkage to reporting groups. Add a new expense account to the operating expenses group, and it immediately appears in any report that references that group. This reduces maintenance effort and ensures consistency across all financial reporting outputs.
Finance teams gain the ability to create ad-hoc filtered reports—by project, by customer segment, by region—without technical assistance. The same configured structure supports both standard monthly reporting cycles and one-off analysis requests from business leaders. This flexibility eliminates the need for external reporting tools or manual spreadsheet consolidation workflows that introduce version control issues and data accuracy risks.
See Configurable Financial Reporting in Practice
If your finance team still exports data to spreadsheets for custom reports or waits on IT to modify fixed templates, Onfinity’s financial report configuration puts control back in your hands. Request a demonstration to see dimensional filtering and period comparisons in action, or follow us on LinkedIn for practical ERP guidance.