Recording and tracking different parameters is a crucial part of any ERP system. The whole process is dynamic and depends on numerous factors such as the situation, type of the company, industry, etc. Therefore, apart from the standard reports that every ERP provides, the best ERP Solutions come with a number of tools that will allow you to customize and produce reports tailored to your specific business needs, without any kind of programing knowledge. VIENNA Advantage ERP and CRM is an open source ERP solution that can be fully customized to meet your reporting requirements.
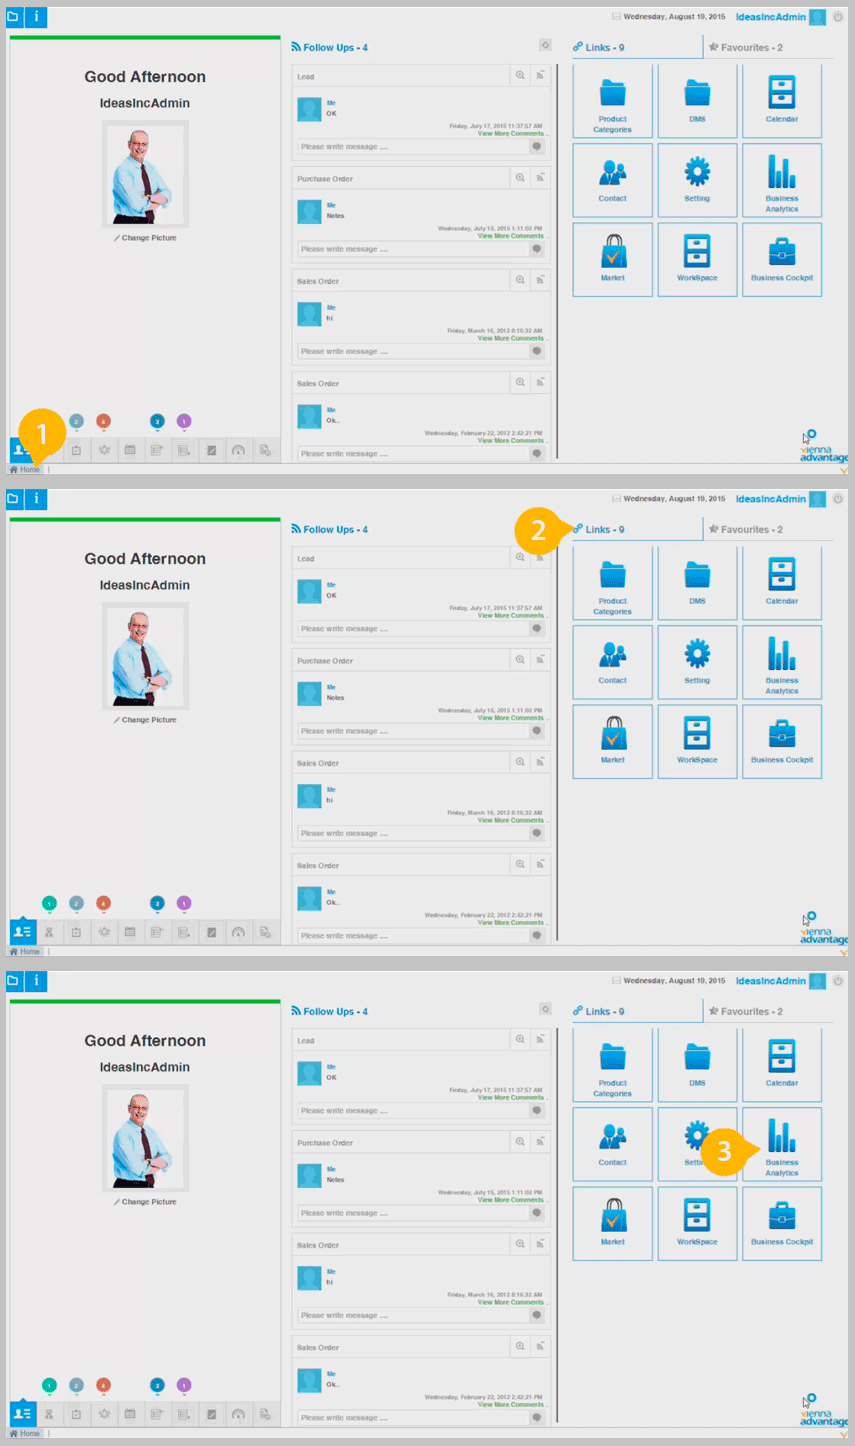
To create a dashboard reports in VIENNA Advantage you will first need to install the Business Analytics cockpit. You can do that by navigating to VIENNA Advantage Market and downloading it from there. After the installation you can access the Business Analytics Menu by going to [1] Home Screen, {2] Links Section, [3] Business Analytics. A new window will open from where you can manage, and create different types of business reports. See picture below.

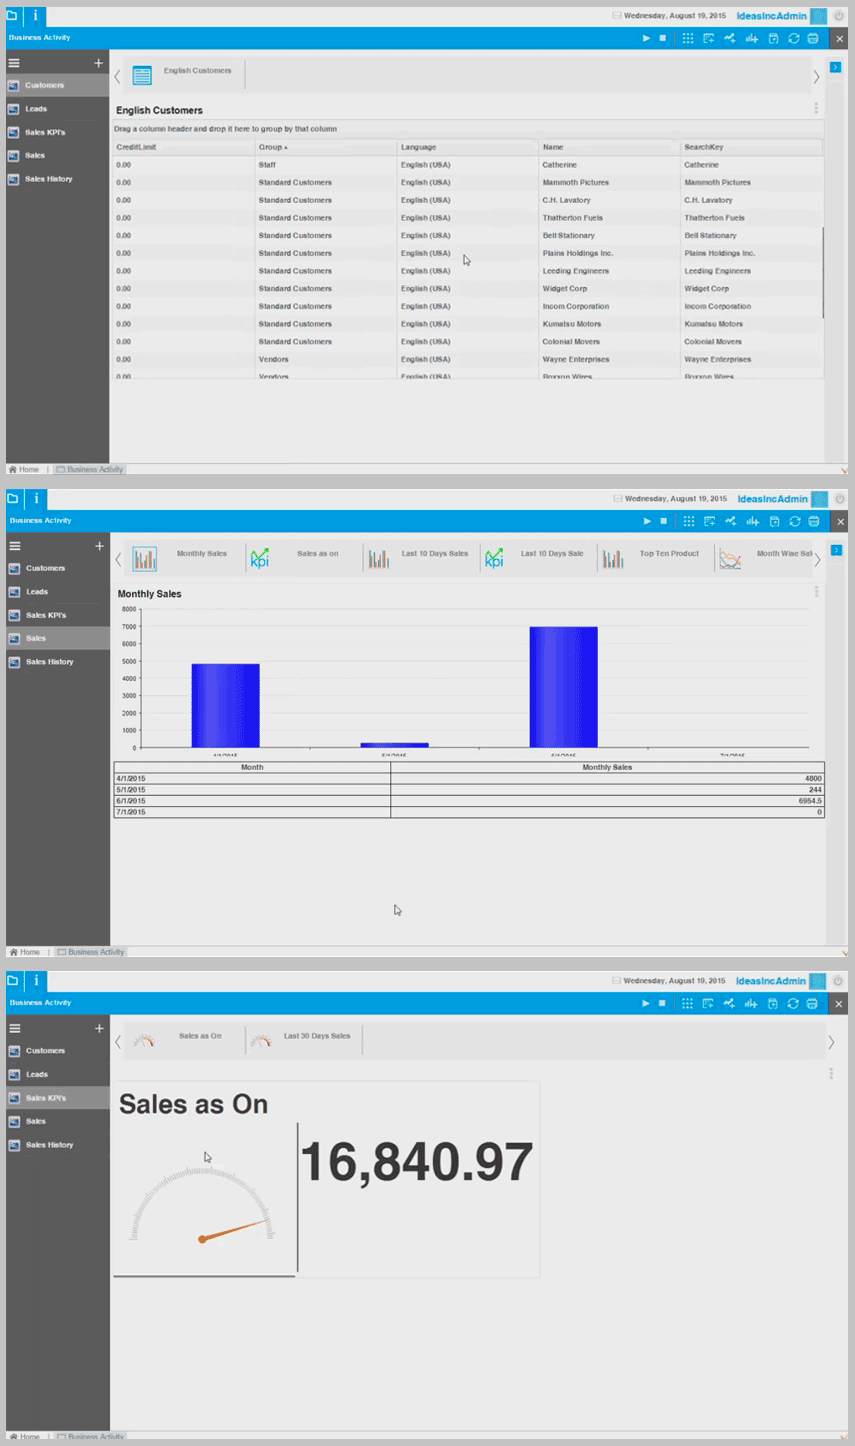
You can choose whether the report to be in tabular, chart, KPI view, and what is more important, since you are working with a real time data you can do different interactive things like grouping data, comparisons, etc.

How to create Chart in VIENNA Advantage?
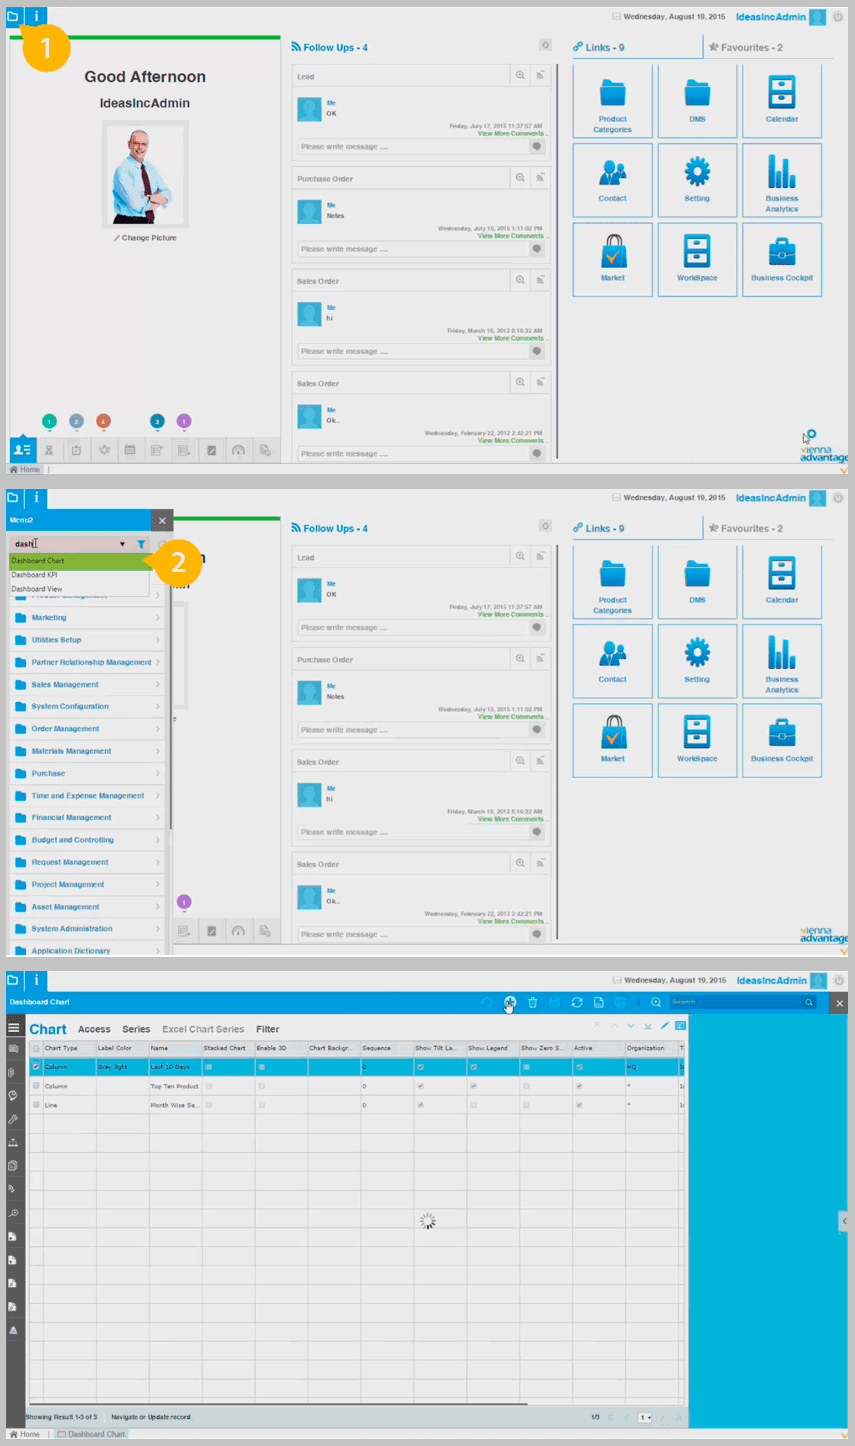
To create a chart a user should navigate to [1] Main Application Menu, then [2] Dashboard Chart. A new window will open where you can add chart and manage all the fields in that chart or edit an existing chart. In the picture below we have shown how to Access the Dashboard Chart window.

How to manage Dashboard and Charts in VIENNA Advantage?
After setting up parameters for a chart, and adding the chart in the Business Analytics you can manage the way the data will be presented on the screen. You can edit the type of the chart (pie, bar, line…), the color, legend, etc.
Another dynamic feature is that if you click on a specific point of the time on the chart, it will show you all transactions that has happened on that specific date.
You can add multiple charts in one window in order to better compare data from different sources, and you can print charts, edit and delete particular data from charts or delete whole charts.
The Filter Section is another interesting option if you want to explore the data in more detailed way. Here you can apply different types of data filters on the charts and save them.
Another interesting feature is that you can import Excel files and create dashboards based on those files. So even the data doesn’t need to be present in your system, but rather you can use for example some kind of sales data from the field, file that has been updated by people outside the company and bring that data into your system and reflect it directly on your dashboards.
Watch this video to help you start with VIENNA Advantage Dashboards and Charts.