Transform your data into rich visualizations and interactive dashboards
Share, collaborate and make data-driven decisions using Onfinity BI system
download brochure
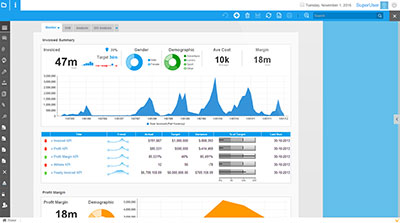
Combine all your data from different sources to track important metrics and KPIs in real-time. Onfinity BI solution helps you go from data to dashboards in hours – not weeks or months. Our BI dashboards are easy to create and highly customizable.
Give your executive team a tool to monitor what’s important and keep your business on track with strategic dashboards. Using Onfinity BI solution, you can connect data from different sources on a single dashboard with high level summary reports and KPIs. This will help you find answers to your questions and act fast.
What happens when you need an instant insight in a meeting, on the road, or in the air? With Onfinity BI solution, you can monitor your most important metrics on any mobile device.
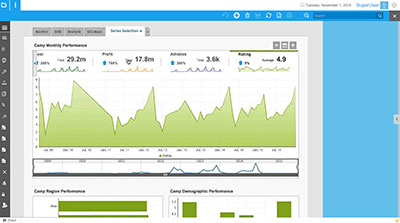
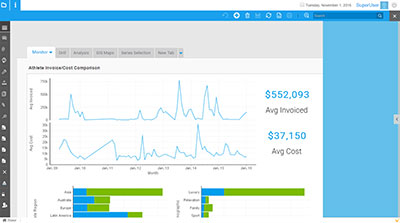
Uncover patterns, identify trends and discover insights! Just connect to any of your favorite data sources and start visualizing with advanced data visualization and Data Discovery capabilities – no coding required.
Use Onfinity BI solution to create beautiful, interactive visualizations. Understand your business from different perspectives with many chart options. Interactively explore your data by adding Drill-Downs, Time-Sliders or Series Selection to your visualizations. Can’t decide which visualization to use? Let Onfinity Auto Chart feature select the best chart – every time.
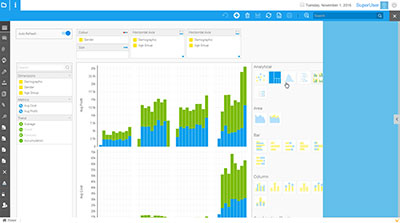
Onfinity helps you make your insights even more engaging, consumable and actionable. Add context and perspective to your charts and data via real-world insights with annotations, images and descriptions.
With Onfinity Business Intelligence solution you can see patterns and spot outliers, but moreover you can easily highlight trends and project forecasts in a few clicks. Use our intuitive predictive analytics capabilities to understand where your business is heading.
Merge your spatial and traditional business data to discover your next big business opportunity. Combine your spatial data with demographic information to uncover fresh insights and gain a deeper understanding of your business. Our Location Intelligence capabilities help put your business on the map.
Tailor your reporting experience so you take the right action at the right time. With proactive broadcasts, alerts and subscriptions, Onfinity BI software keeps you up-to-date with the data and reports that matters to you.
With Onfinity BI solution, you can give everyone in your organization access to the data they need via broadcasts. Now you can distribute highly customized reports to a users’ personal timeline and/or email address.
Subscribe to any report, dashboard and discussion stream that matters to you and keep track of any changes and interactions with your subscribed content via automated notifications posted to your Timeline and sent to your inbox.
Use Onfinity trigger-based alerts to deliver instant notifications to your Timeline. Moreover, drive immediate action with Smart Tasks that automatically create and assign tasks for completion. Boost accountability and take the right action at the right time.
Empower your employees to share reports and dashboards with anyone inside or outside your BI platform. Add context and to your data, and use your Timeline to follow people, discussions and data that matters to you.
Onfinity BI solution enables faster, smarter, and more efficient collective decision-making. We are redefining what Collaborative BI means in the BI industry! Traditional BI platforms leave you disconnected from where people make decisions – in the field, via email, and in meetings. Use Onfinity BI software to find and share valuable insights that supports your data-driven decisions.
Now it’s easier than ever to share important insights throughout your organization. Distribute, export and email BI content as well as disseminate Onfinity reports, dashboards and Storyboards in a multitude of ways. You can also attach reports or dashboards discussions and share links to give people access to your insights.
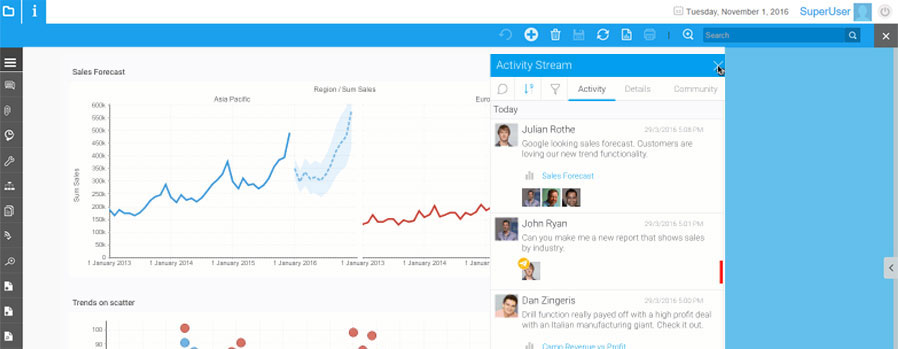
When it comes to discussing data, email falls short. But luckily for you, Onfinity Activity Streams combine human knowledge with business data to make your entire organization smarter. With our Business Intelligence solution you can discover a better way of discussing the big issues and ideas, and collectively deciding the best course of action. Start a conversation related to any piece of Onfinity BI content or add context with annotations, comments, links and attachments. Even begin a separate Discussion Stream on any topic within Onfinity BI platform – analyze data, embed reports, create polls and exchange ideas with co-workers.
Because collaboration is more than just comments on reports, Onfinity introduced ‘Timeline’. Use it to follow, share, interact and collaborate with the BI content, colleagues and discussions that matter to you. Timeline provides a truly collaborative BI experience. It displays your individual activities and interactions within Onfinity BI in real-time. See the latest insights as they happen, vote on ideas, as well as track and understand how decisions are really made within your organization.
Share live and interactive reports or dashboards outside your BI solution, on any Web-based platform. Distribute your insights across platforms – whenever and wherever BI content is needed for discussion and decision-making.
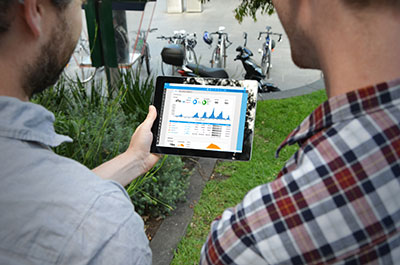
Onfinity BI system provides a clear framework for business users and data experts in your organization to connect, collaborate and produce better business insights. In this way the platform encourages every BI user to actively participate in the entire data-driven decision-making process.
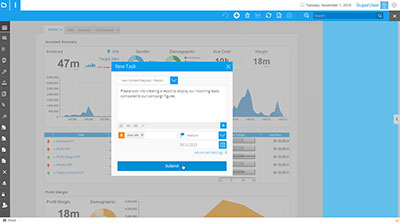
Any employee within your organization can raise and assign tasks from anywhere inside your BI platform using Onfinity task management system. Now you can easily request, track and review content or analysis. The result: business users have visibility over what’s being worked on, while data analysts benefit from clear requirements and prioritization.
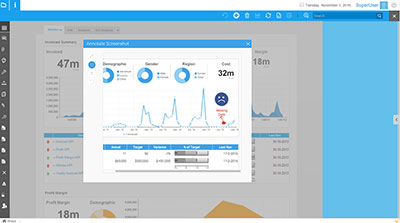
The trust in your data and BI platform is critical. If users suspect the validity of your data, they’ll just stop using the BI platform. That is why Onfinity provides tools to empower employees to flag data quality issues with in-platform screenshots and annotations. In this way you’ll ensure your data and analytic content is more trusted than ever.
Manage the entire lifecycle of your BI projects with our inbuilt Discussion Boards. Brainstorm ideas, organize tasks and manage projects – all from within your BI platform.
Visualize and organize workflow into Activity Streams to boost transparency. Monitor and communicate progress with ease.
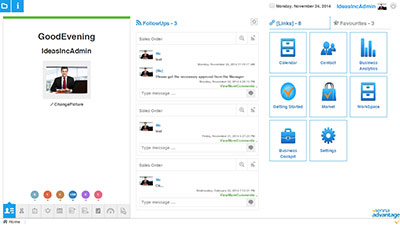
Many important decisions are made in meetings. So why settle for static screenshots of Excel reports pasted into PowerPoint? Now you can deliver engaging presentations and share live data with our fully integrated and interactive presentation tool for BI content.
Create persuasive and engaging presentations for your audience. Quickly combine rich interactive media, such as video or audio clips, as well as images and custom text, with live reports and intuitive navigation.
Creating Storyboards is fast and easy. There are numerous themes available for you. Just pick one and focus on telling your story instead of worrying about layout, design and formatting.
Our Storyboard functionality is specifically designed for mobile delivery. Take your Storyboards with you to deliver and share powerful presentations anywhere, anytime.
Want to flag a page for further discussion, or maybe you found some error or issue? Onfinity Storyboard lets you comment on and bookmark content, adding another collaborative and interactive element to your presentations. You can even add Storyboards to your ‘favorites’ or snapshot reports at a specific point-in-time.
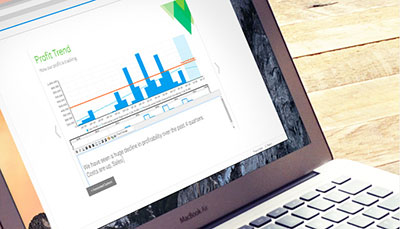
With versioning, you can simply copy and update your presentation with new commentary and slides whilst maintaining past versions for reference. Monitor and control who has access, commenting and editing rights to each Storyboard.
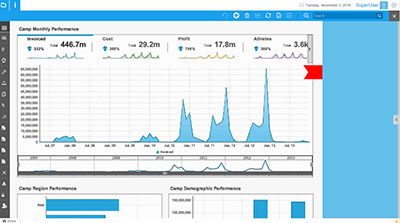
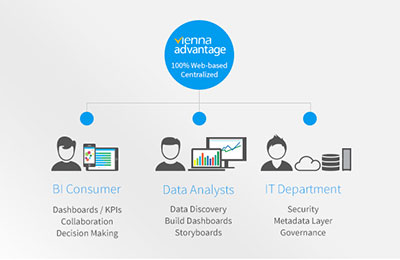
We deliver all the BI functionality you need via a single-integrated platform. The result? Your data analysts feel well supported to create quality BI content, your BI consumers enjoy a great user experience, and your IT people have all the governance features needed to ensure trust and security in your BI platform.
Onfinity is a completely Web-based BI platform, deployed on a centralized architecture, with governance baked into the application. That way, you can give business users the platform they need to consume, share and collaborate on trusted data; analysts the self-service freedom to create reports and build dashboards; while IT have complete security and governance over the platform.
In Onfinity BI system administrators can manage, view and search system-wide configurations – from data sources, meta-data layers, language settings and users – in one place. They can even optimize their BI environment and reporting content by tracking usage patterns with audit reports. With Onfinity is easy to manage your entire BI deployment using the highly intuitive Administration Console.
In Onfinity BI solution, non-technical business users have the confidence to independently act on BI-based insights because they have access to clean data that’s ready to analyze. Our meta-data layers enable users to reuse business logic and deliver a consistent view of their data in simple business terms.
Don’t let ungoverned self-service BI initiatives create inconsistencies that adversely affect your business. Onfinity provides you with a single governed BI platform that gives IT administrators control over data, reports, roles and functionality permissions for all your users.
Onfinity BI provides you with a role, group and data level security model that you can configure as you wish.
Onfinity BI solution makes it easy for you to connect to all your enterprise data sources – wherever they are. You can even mash-up multiple data sources to create a single report or dashboard. Connect your spreadsheets, databases, web applications… We don't put barriers between you and your data.
Your data is stored in many different systems, applications and databases. Whether on-premise or on the cloud, Onfinity BI lets you analyze them all. Even combine multiple data sources to create a single report or dashboard without the pain of having to build a data warehouse.
Give your colleagues greater visibility via dashboards, alerts and broadcasts, discussions, or present your data live in meetings with Storyboard. No matter how you share your insights and reports, Onfinity BI solution ensures they’re all accessible from one place.
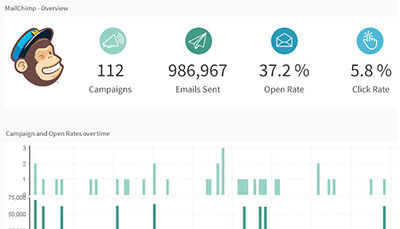
Connecting to your favorite Web applications is now as easy as connecting to your on-premise databases. Create, share and act on analytical insights from your most important third-party Web apps such as MailChimp, Google Analytics, Zendesk etc.
Connect to your favorite online applications and explore your data in interactive dashboards. Onfinity BI solution provides pre-built reports and dashboards for its entire range of out-of-the-box connectors. Simply connect to your most important apps to gain instant insights.
Build your own connectors for any third-party Web app using Onfinity ‘open’ connector framework. Then simply create, visualize and act on your analytical insights. Moreover, connect your BI solution with Onfinity open source ERP / CRM software, Document Management system, Point of Sale system or use our Application Development Framework to develop custom business apps.
Stay productive! Monitor KPIs and share live data from your favorite mobile device. All business intelligence reports and dashboards are instantly available on any device – no rework required.
Use any mobile device to access reports or dashboards created on your desktop PC or laptop, immediately and securely. Onfinity BI system keeps your content visually consistent – regardless of where it’s accessed. We get data into the hands of those who need it quickly, saving you time and money.
Onfinity strives to deliver fun and easy-to-use mobile BI experience. That is why we have worked hard to deliver a fantastic UI and UX, combining outstanding collaborative features with great usability – simply swipe to browse dashboards, filter with a tap of a finger, or pinch and zoom.
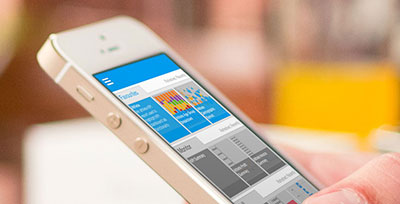
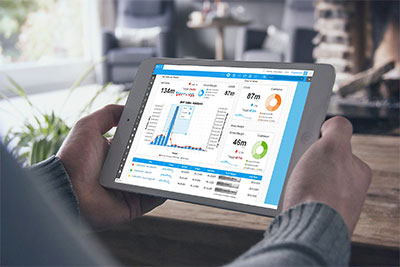
With Onfinity BI, your business is at your fingertips. Refresh and analyze all your KPIs anywhere, anytime. Flick through financial charts and graphs. Interact with, filter, sort and analyze your data - all with the touch of your fingers.
Discuss, share, collaborate or present your ideas in a meeting right from your tablet or mobile phone. Onfinity BI solution focus on the needs of decision-makers. We help you share insight and collaborate with your peers.